Announcement
CloudJoi Annual Data Report 2025: Discovering the Next Chapter
Published on 06/04/2026
Now in its third edition, the CloudJoi Annual Data Report 2025 looks beyond headline numbers to understand how audiences discover shows, how they make decisions, and where growth is taking place across the country. Based solely on events hosted on CloudJoi between 1 January and 31 December 2025, the findings reflect one lens — but we hope it's a useful one for organisers, artists, and partners making decisions about the future of live experiences in Malaysia.
Key Highlights
The most notable shift this year is not in Klang Valley, but beyond it. Show count outside Klang Valley grew by 55% compared to 2024, with Johor standing out as a consistent market at a 70% fill-up rate across 63 shows, making it the most reliable non-central region. The Northern Region also improved, with fill-up rates rising from 63% to 73%.
Across the five performing arts categories, all grew in 2025. Comedy led in volume with 347 shows and the strongest fill-up rate at 67%. Music moved the most tickets at 70,900. Musical had the highest average ticket price at RM158. Overall, RM15.1 million in ticket sales across 1,118 shows.
Active organisers more than doubled to 483 and shows grew 62% year-on-year, but the average fill-up rate dipped to 65% and revenue grew only 5%. Supply is expanding faster than the audience. That gap is the defining challenge and opportunity for 2026.
Why You Should Read This Report
Whether you're a producer, performer, venue operator, or a passionate supporter of the arts, there's something here for you.
- For Producers & Organisers: Understand which months, days, and times your audience is most likely to buy. Use regional data to identify where demand is growing and where your next stop could be. See how shows at different scales perform across categories.
- For Creatives & Performers: See how your art form is trending, which formats are filling well, and how audience demographics are shifting.
- For Partners, Funders & Institutions: Get a clearer picture of the live arts ecosystem — its scale, reach, and the communities it's serving across Malaysia and beyond.
Download & Explore
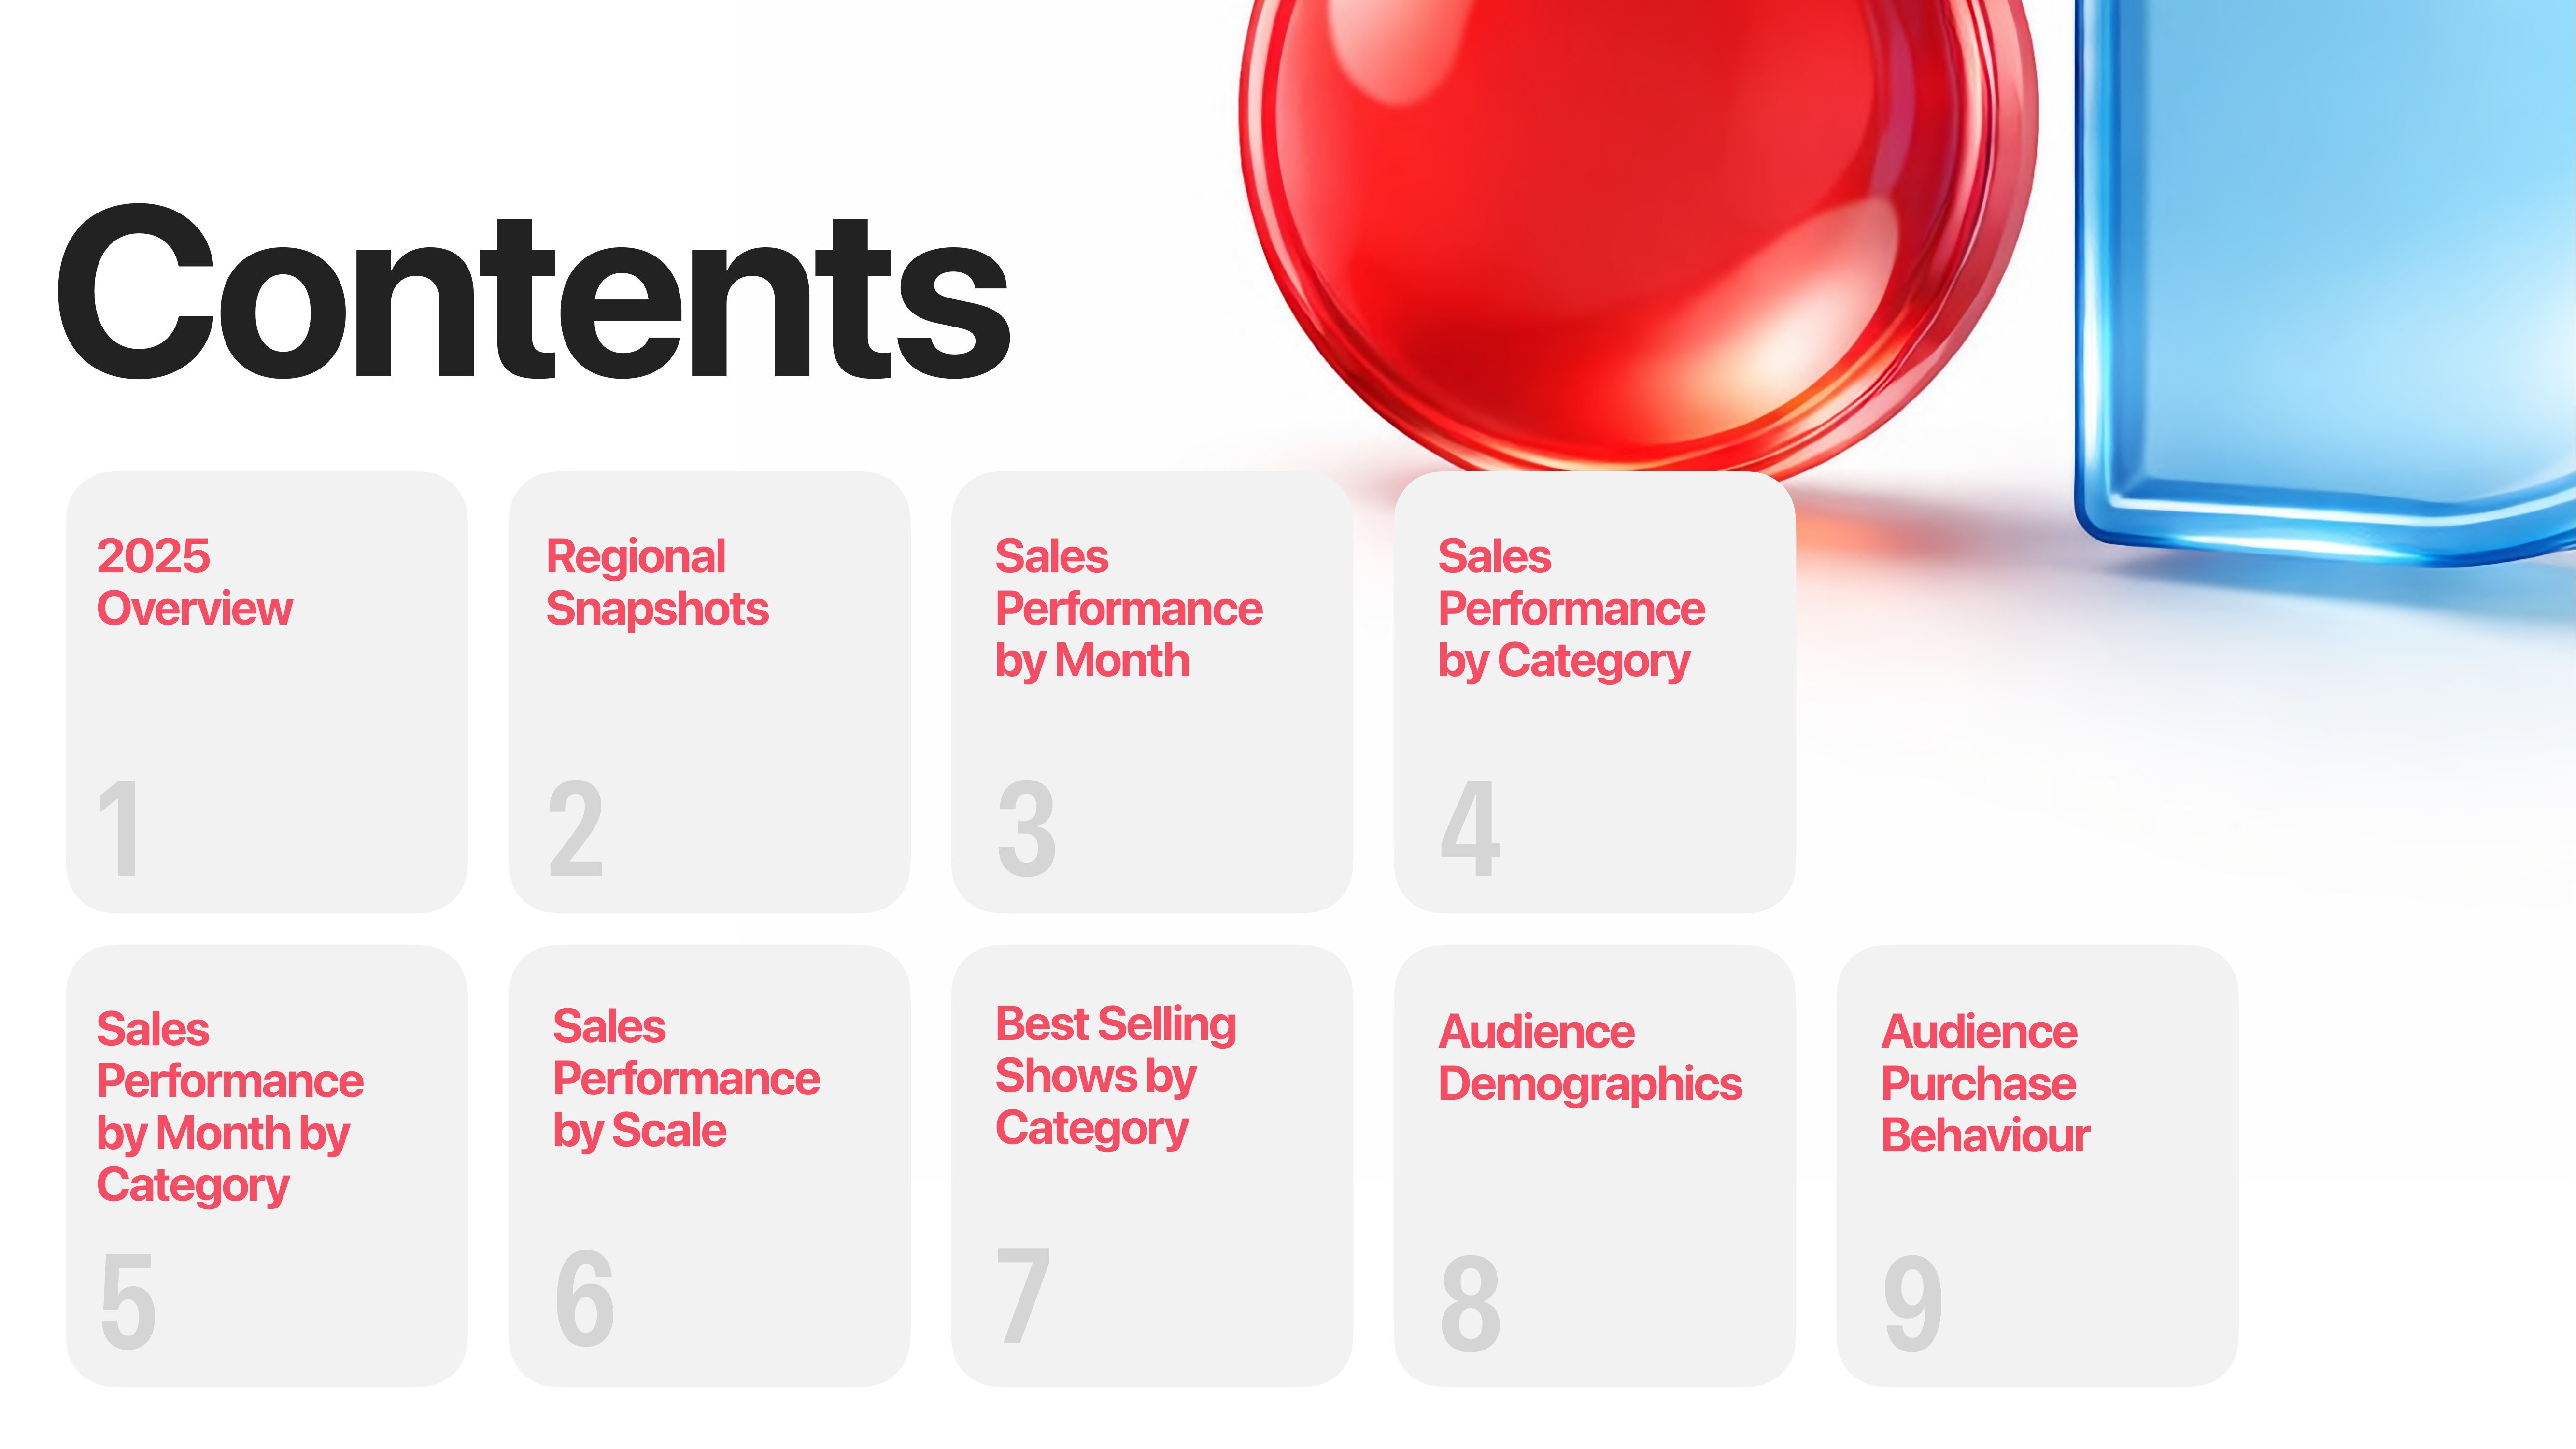
The full 2025 report spans over 35 pages of in-depth analysis, covering sales performance by month, category, scale, and region — as well as audience demographics and purchase behaviour. Download your copy, explore the insights, and let's use this data to grow the ecosystem together.